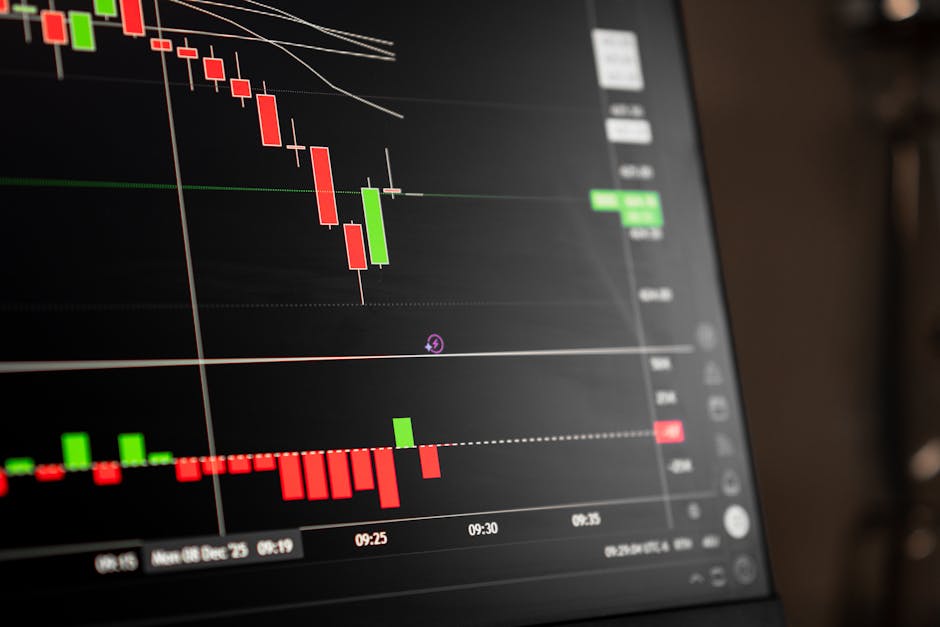
Price does not usually reverse in a single candle. It stalls first. The crowd that was pushing one direction runs out of buyers or sellers, hesitates for a bar, and then the other side takes over. Morning star and evening star patterns are the clearest three-candle picture of that handoff, and once you see the shape you cannot unsee it.
They are among the more useful reversal signals on a chart, but only if you respect the one thing most traders ignore: where they appear matters far more than that they appeared at all.
What morning star and evening star patterns actually are
Morning star and evening star patterns are three-candle reversal formations. Each one tells a small story in three acts: strong move, pause, reversal. The morning star is the bullish version and shows up after a decline. The evening star is the bearish version and shows up after a rally. They are mirror images of the same idea, so once you understand one, you understand both.
The name is not just decoration. A morning star is the planet you see rising just before dawn, so the pattern marks a bottom before price rises. An evening star appears at dusk, so it marks a top before price falls. Corny, but it makes the two easy to keep straight.
If candlesticks are still new to you, it helps to be comfortable reading a single bar first. Our guide on how to read a candlestick chart covers the body, wicks, and what open and close actually tell you.
The morning star (bullish)
A morning star forms at the end of a downtrend and has three parts:
- A long red candle. Sellers are firmly in control. This candle fits the existing downtrend and gives no hint of a turn on its own.
- A small-bodied candle. Price gaps or stalls lower, but the body is short. Buyers and sellers fought to a near draw. This is the moment momentum runs out of gas.
- A long green candle. Buyers take over and push back up, ideally closing well into the body of that first red candle.
The further the third candle closes back into the first, the more convincing the reversal. A green candle that only nibbles at the bottom of the red one is weaker than one that recovers half or more of it.
The evening star (bearish)
Flip everything and you have an evening star at the end of an uptrend:
- A long green candle. Buyers in control, trend intact.
- A small-bodied candle. Price stalls near the highs. The advance loses steam.
- A long red candle. Sellers take over and drive back down into the body of the first green candle.
Same three-act structure, opposite ending. Big move, hesitation, reversal.
Why the middle candle matters
The middle candle is the hinge of the whole pattern. The first candle tells you who was winning. The third tells you who won. But the middle candle is where the fight became a stalemate, and that stall is what makes the reversal believable.
A lot of people assume the middle candle has to be a doji, where open and close are almost identical. A doji does make the indecision cleaner, and a doji in the middle slot is sometimes called a morning or evening doji star. But it is not required. Any small real body works, because the message is the same: neither side could extend the move.
What you do want is a middle candle that stands apart from the first, either by gapping or by clearly stalling. If the three bodies just blend into one continuous move, you do not really have a star. You have three candles standing next to each other.
Why location beats the pattern itself
Here is the part that separates traders who use these patterns well from traders who get chopped up by them. A morning star in the middle of nowhere is close to noise. A morning star sitting right on a level that has held before is a different animal.
The reason is simple. A reversal pattern is a clue that sentiment is turning. A support or resistance level is a price where sentiment has already turned before. When the two line up, the candle pattern is confirming something the structure was already hinting at. That agreement is what gives the signal weight.
So before you get excited about a star, ask where it printed:
| Location of the star | How much weight it carries |
|---|
| At a tested support or resistance level | Higher. Two independent clues agree. |
| At a round number many traders watch | Moderate. Attention concentrates there. |
| In the middle of a range, no level nearby | Low. Little structural backing. |
| Against the larger trend with nothing supporting it | Low. Fighting the dominant flow. |
If you are shaky on how these levels form and why they hold, read what is support and resistance in trading first. The star patterns make a lot more sense once you can spot the zones they should appear near.
The larger trend matters too. A morning star lands better when the higher time frame is already leaning up and price has pulled back into support. An evening star lands better when the higher time frame is already tired and price has stretched into resistance. Trading a star straight against a strong, healthy trend is possible, but you are asking a three-candle signal to do a lot of heavy lifting alone.
How to trade them without fooling yourself
A few habits keep these patterns honest:
Wait for the third candle to close. The pattern is not confirmed until that final candle finishes. A candle that looks like a beautiful reversal two-thirds of the way through can close as nothing. Judging a live bar is guessing.
Favor higher time frames. On a daily or 4-hour chart, each candle reflects real participation. On a 1-minute chart you will see stars constantly and most are meaningless. Slower charts filter out a lot of junk.
Let other tools agree. A star that lines up with a level, a moving average, or a stretched oscillator is stronger than a star standing alone. You are not looking for confirmation from ten indicators, just a second opinion or two. If you tend to pile on tools, how many indicators should you use is worth a look.
Define your invalidation before you enter. For a morning star, the low of the pattern is the natural line in the sand. If price closes back below it, the reversal failed and there is no reason to hang around. Knowing that level in advance keeps the decision clean instead of emotional.
A lot of the discipline here is just not taking every star you see. Most of them are not at a level, not with the trend, and not worth a trade. A trend tool that stays flat most of the time and only calls a side when the bigger picture agrees can quietly keep you out of the low-quality ones. That is roughly the job Vektor is built to do on gold and Bitcoin.
Made by Vektor
Built by the team behind Vektor.
We build trend tools for TradingView. The gold and Bitcoin system we run is a straightforward subscription. Cancel anytime.
One honest caveat: no candlestick pattern predicts the future, and any star can fail even in a picture-perfect spot. Treat them as evidence that tilts the odds, size your risk accordingly, and never as a promise.
Common mistakes
- Trading the pattern anywhere. The single biggest error. A star with no level behind it is not the same signal as one on tested support.
- Ignoring the trend context. Fighting a strong, one-way move on the strength of three candles is a hard way to trade.
- Reacting to a live candle. The third bar has to close. Full stop.
- Skipping the invalidation. If you cannot say where the idea is wrong, you are not trading a pattern, you are hoping.
Morning and evening stars are among the most reliable candlestick patterns precisely because they show a clear stall and flip rather than one dramatic candle. But reliable is relative. The pattern gives you the shape. You still have to supply the location, the trend context, and the risk plan. Get those three right and the star becomes a genuinely useful read. Get them wrong and it is just three candles that happened to line up.
FAQ
What is the difference between a morning star and an evening star?
They are mirror images. A morning star forms at the bottom of a downtrend and points up: a big red candle, a small stalling candle, then a strong green candle. An evening star forms at the top of an uptrend and points down: a big green candle, a small stalling candle, then a strong red candle. Same three-act structure, opposite direction.
Does the middle candle have to be a doji?
No. The middle candle just needs a small real body that shows momentum stalling. A doji makes the indecision cleaner and a bit more convincing, but any small-bodied candle that gaps or stalls away from the first candle qualifies. The confirmation comes from the third candle, not the middle one.
How reliable are morning and evening star patterns?
It depends almost entirely on where they show up. At an established level, in the direction of the larger trend, they carry more weight. Floating in the middle of a range with nothing structural nearby, they are close to noise. No single candlestick pattern is a guarantee, and any of them can fail.
What time frame works best for these patterns?
Higher time frames like the 4-hour and daily produce cleaner, more meaningful stars because each candle represents more participation. On a 1-minute chart you will see dozens a day and most mean nothing. Slower charts filter out a lot of the false signals.