Bitcoin8 min
Bitcoin Trend Trading Strategy: How to Ride the Big Moves
A plain-spoken, teachable way to trade Bitcoin with the trend, enter on continuation, and use a trailing stop to ride winners and cut losers.
VektorAlgo Research
Notes on trading gold and Bitcoin, reading indicators, and getting more out of TradingView. From the team that builds Vektor.
A plain-spoken, teachable way to trade Bitcoin with the trend, enter on continuation, and use a trailing stop to ride winners and cut losers.
Find the right gold symbol, pick a timeframe, read the trend, and set an alert so you are not stuck watching the screen all day.

The Momentum indicator measures how fast price is moving, not just where it is. Here is how to read it, why it can turn before price does, and where it lies to you.

Three lines, one job each: an EMA for direction and ATR bands for stretch. Here is how to read Keltner Channels without fooling yourself.

The Commodity Channel Index measures how far price has strayed from its own average. Here is how to read the zero line and extreme readings without treating them as automatic reversals.

The MFI is RSI with a memory for volume. Here is how it reads buying and selling pressure, and where its divergences actually mean something.
Williams %R shows where the close sits in the recent high-low range. Here is how it flags overbought and oversold, how it stacks up against stochastics, and why extremes lie in strong trends.
TradingView ships with plenty of intervals, but rarely the exact one your strategy wants. Here is how to build, save, and actually use custom timeframes.

Bill Williams' histogram compares two moving averages of price midpoints. Here is how to read its zero-line crossovers and bar patterns as context, not as standalone buy and sell buttons.
OBV adds volume on up days and subtracts it on down days, turning raw participation into a line you can watch. Here is how to read it without fooling yourself.

Two converging trendlines, one slowing move, and a break that tells you which way the crowd finally gave up. Here is how to read wedges without fooling yourself.

Publishing an idea turns a chart into a public, timestamped call. Here is how to write one that is clear, honest, and worth reading later.

Line up a higher timeframe for trend and a lower one for timing so your entries agree with the bigger picture instead of fighting it.

One number tells you how many ounces of silver it takes to buy an ounce of gold. Here is how it is built, what it hints at, and why it is context, not a trade signal.

Price leaves a trail of highs and lows. Learn to read that sequence so you trade with the dominant direction instead of fighting it.

Two failures at the same level can hint the trend is tired. Here is how the neckline confirms a double top or double bottom, and how to place invalidation without pretending you know the future.

A practical list of the TradingView keyboard shortcuts worth memorizing, plus the small set that will change how fast you move around a chart.

A pin bar is one long wick, a small body, and a story about who lost the fight at a price level. Here is how to read it without fooling yourself.
Liquidity is the depth of resting orders that lets you get in and out without shoving price around. Here is how it works and why price keeps reaching for it.

Stop rebuilding the same chart from scratch on every symbol. Here is how to create, apply, and manage TradingView chart templates so your analysis stays consistent.

A rounded base and a small pullback that traders read as a continuation setup. Here is how the shape forms, where the breakout sits, and why volume and trend decide whether it means anything.

Flags and pennants are short pauses inside a strong move. Here is how to read the pause, mark the breakout, and manage the trades that fail.

Bitcoin's tie to equities swings between tight and loose depending on the liquidity and risk backdrop. Here is why it moves, how to measure it, and what a rising or falling correlation says about the regime.

Pivot points turn yesterday's high, low, and close into today's reference map. Here is how the central pivot and its levels actually work.
Donchian Channels track the highest high and lowest low over a lookback. Here is how the bands frame trend, mark range boundaries, and flag a breakout worth studying.
Build, sync, and save multi-chart layouts so you can monitor several symbols and timeframes in one tab without clicking around all day.

Every order is a trade-off between getting filled and getting your price. Here is how market, limit, and stop orders behave, and where each one earns its keep.

A trading plan puts your decisions on paper before emotion shows up. Here are the sections that matter and how to keep it short enough to use.

A hammer is one candle telling a small story: sellers pushed price down, buyers shoved it back up. Here is where it actually matters and where it is just noise.
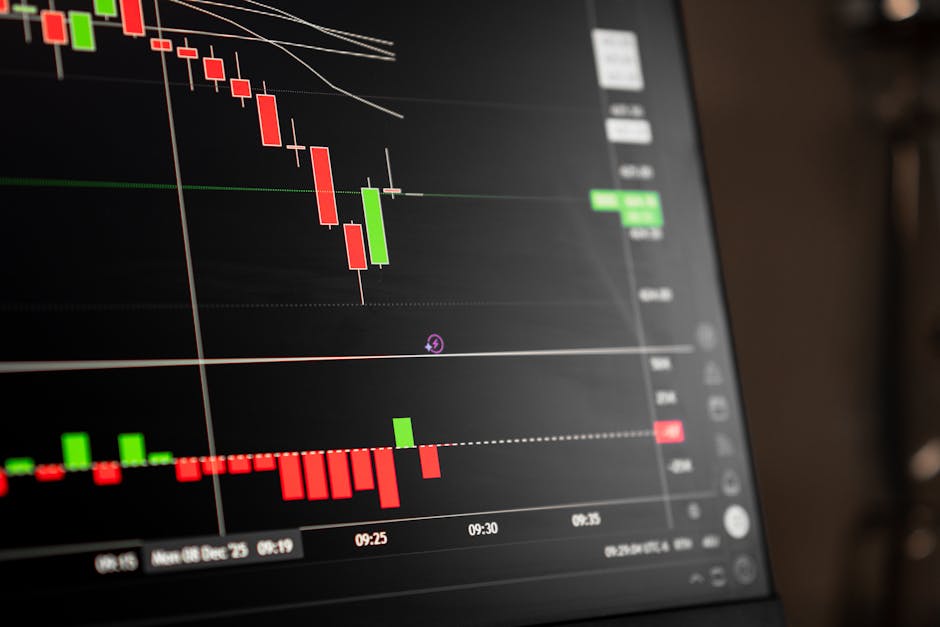
Two three-candle reversals that show momentum stalling and flipping, and why they only earn your attention at real support or resistance.
How a coiling range sets up the next big move, and why waiting for the breakout beats guessing which way it goes.

A bullish or bearish engulfing candle can flag a momentum shift, but only location and trend context tell you whether to care.

Weekly jobless claims are a high-frequency pulse on the labor market. Here is how they nudge rates, the dollar, and gold, and why one print means almost nothing.

Physical gold demand rises around major jewelry and gifting seasons. Treat it as one input among many, never as a standalone price call.
Four times a year, three kinds of contracts expire at once. Here is what actually happens to volume and price, and how to keep from reading noise as trend.

Gold pays no yield, so what the market expects rates to do tends to matter more than where rates sit today. Here is how to read those expectations.

GDP tells you whether growth is speeding up or slowing down. Here is how that feeds rate expectations and risk appetite, and what to actually watch on release day.

Rebalancing and book-squaring can push money into or out of gold near the close of a quarter or year, independent of anything happening in the real economy. Here is what to watch.

QT drains liquidity from the system. Here is what that slow, boring process actually does to the backdrop for gold and bitcoin, and what to watch instead of guessing.
The VIX measures expected stock-market volatility. Here is how those fear spikes tend to ripple into gold and bitcoin, and why the VIX is context, not a trade signal.

The Fed targets one inflation gauge and the headlines chase the other. Here is what actually separates the PCE from the CPI, and why they drift apart.

The producer price index measures cost pressure before it reaches the till. Here is how a PPI surprise reaches gold through rate expectations, and why you read it alongside the CPI rather than alone.

Big funds reset their allocations back to target on the last trading day, and that shuffle can push price around with no headline behind it. Here is the mechanic and what to watch.

When stress rises, capital rotates toward perceived safety and gold usually catches a bid. Here is the mechanism, the gauges to watch, and why most spikes fade.

Bitcoin has moved in a rough four-year rhythm tied to its halving supply schedule and swinging sentiment. Here is the mechanism, phase by phase, and why past rhythm is not a schedule you can trade blind.
A weekly scan of the releases that move gold and Bitcoin, plus the blackout windows that stop a scheduled surprise from wrecking a clean setup.

Falling real yields and a softer dollar tend to support gold during a cutting cycle, but the path is rarely a straight line. Here is the mechanism and what to track.

Capital chases growth in risk-on moods and hides in risk-off ones. Here is how bitcoin usually behaves in each, and the cross-asset cues that tell you which one you are in.

A hot inflation print and a cool one push gold in opposite directions. Here is the chain of logic, and what to actually watch when the number drops.

When the big desks go quiet for a holiday, order books thin out and normal-sized trades push price further than usual. Here is what changes and how to trade around it.
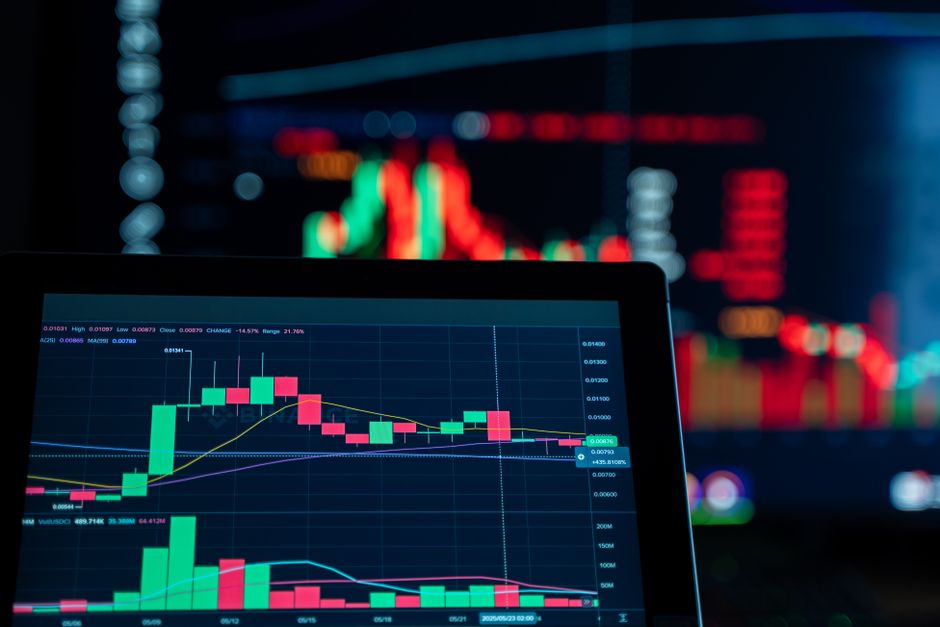
The halving cuts new supply in half, not the price. Here is how to trade the volatility around it without betting on a date.

The dot plot is a map of where rate-setters think rates are going. Here is how to read it for gold without pretending it predicts a price.
Spot-ETF inflows and outflows show whether regulated buyers are net adding or trimming exposure. Here is how to read them as context, not a crystal ball.
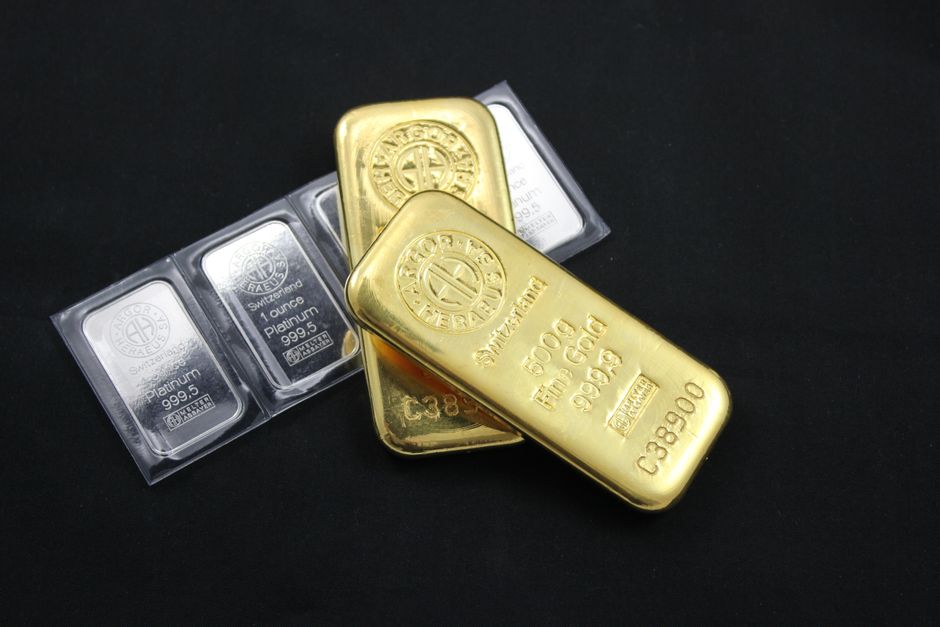
Gold can open away from Friday's close when news breaks over the weekend. Here is how to read the gap, watch for a fill, and manage exposure instead of guessing direction.
The first candle after a big release is a liquidity trap. Here is how the mechanics actually work and what to watch instead of chasing.

Gold pays you nothing, so it lives or dies on what you give up to hold it. Real yields are that number, and they explain more gold moves than any headline.

Nonfarm payrolls can whip gold both directions in seconds. Here is how to read the number and wait for the move that actually sticks.
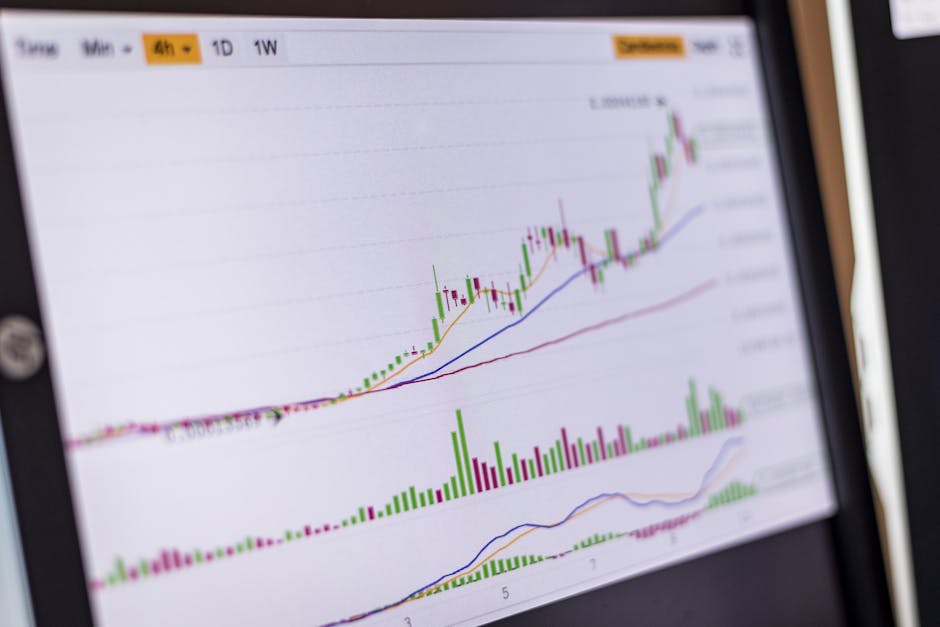
Bitcoin trades more like a risk asset than a hedge on Fed days. Here is the plumbing behind that, and how to watch it without guessing direction.
Rate days move gold through real yields and the dollar. Here is how the mechanics work, what to watch, and why you let price confirm before you enter.

A watchlist of the recurring forces that move gold, so you can read conditions without pretending to predict them.
Rate decisions, CPI, and jobs reports move gold and Bitcoin fast and both ways. Here is how to decide your stance before the number prints.
Two of the clearest windows into how one-sided and leveraged bitcoin has become, and why they belong in your context column, not your trigger column.