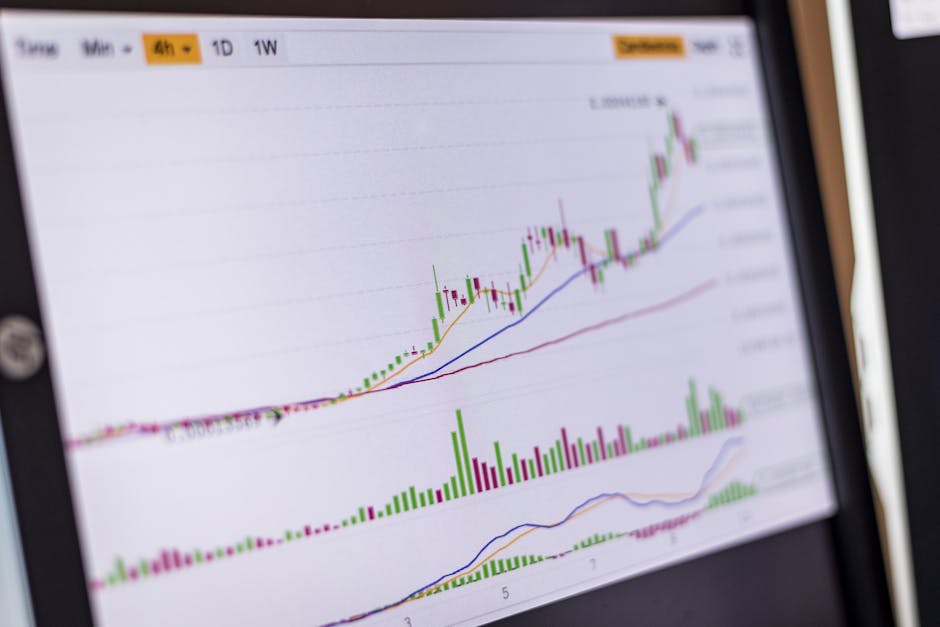
Wedge Patterns Explained: Rising and Falling Wedges
Two converging trendlines, one slowing move, and a break that tells you which way the crowd finally gave up. Here is how to read wedges without fooling yourself.
Method, risk management and the discipline behind good trades.

Two converging trendlines, one slowing move, and a break that tells you which way the crowd finally gave up. Here is how to read wedges without fooling yourself.

Line up a higher timeframe for trend and a lower one for timing so your entries agree with the bigger picture instead of fighting it.

Price leaves a trail of highs and lows. Learn to read that sequence so you trade with the dominant direction instead of fighting it.
Two failures at the same level can hint the trend is tired. Here is how the neckline confirms a double top or double bottom, and how to place invalidation without pretending you know the future.

A pin bar is one long wick, a small body, and a story about who lost the fight at a price level. Here is how to read it without fooling yourself.

Liquidity is the depth of resting orders that lets you get in and out without shoving price around. Here is how it works and why price keeps reaching for it.
A rounded base and a small pullback that traders read as a continuation setup. Here is how the shape forms, where the breakout sits, and why volume and trend decide whether it means anything.
Flags and pennants are short pauses inside a strong move. Here is how to read the pause, mark the breakout, and manage the trades that fail.

Every order is a trade-off between getting filled and getting your price. Here is how market, limit, and stop orders behave, and where each one earns its keep.

A trading plan puts your decisions on paper before emotion shows up. Here are the sections that matter and how to keep it short enough to use.
A hammer is one candle telling a small story: sellers pushed price down, buyers shoved it back up. Here is where it actually matters and where it is just noise.

Two three-candle reversals that show momentum stalling and flipping, and why they only earn your attention at real support or resistance.

How a coiling range sets up the next big move, and why waiting for the breakout beats guessing which way it goes.
A bullish or bearish engulfing candle can flag a momentum shift, but only location and trend context tell you whether to care.
Weekly jobless claims are a high-frequency pulse on the labor market. Here is how they nudge rates, the dollar, and gold, and why one print means almost nothing.

Four times a year, three kinds of contracts expire at once. Here is what actually happens to volume and price, and how to keep from reading noise as trend.
GDP tells you whether growth is speeding up or slowing down. Here is how that feeds rate expectations and risk appetite, and what to actually watch on release day.

The VIX measures expected stock-market volatility. Here is how those fear spikes tend to ripple into gold and bitcoin, and why the VIX is context, not a trade signal.
Big funds reset their allocations back to target on the last trading day, and that shuffle can push price around with no headline behind it. Here is the mechanic and what to watch.

A weekly scan of the releases that move gold and Bitcoin, plus the blackout windows that stop a scheduled surprise from wrecking a clean setup.

When the big desks go quiet for a holiday, order books thin out and normal-sized trades push price further than usual. Here is what changes and how to trade around it.

The first candle after a big release is a liquidity trap. Here is how the mechanics actually work and what to watch instead of chasing.

Rate decisions, CPI, and jobs reports move gold and Bitcoin fast and both ways. Here is how to decide your stance before the number prints.

The boring, repeatable reasons accounts blow up: overtrading, no defined risk, revenge trades, and mistaking activity for edge.

Why these zones form, how to draw them as areas instead of exact lines, and why they break more often than beginners expect.

Win rate gets all the attention. Risk-reward is what actually pays the bills. Here is how the two work together, and why a strategy that loses more often than it wins can still make money.

Willpower runs out. Rules don't. Concrete habits that take the decision out of your hands at the exact moment you'd blow it.

Time, stress, fees, and where a real edge actually lives. A plain look at two speeds of trading, and why faster is not the same as better.

Two opposite ways to make money in markets. One sells the extremes, one rides them. Here is the honest case for why volatile assets reward the trend rider.
Stop guessing your trade size. The fixed-fractional method turns your stop distance into an exact position size, and it works the same on gold or Bitcoin.
Place stops at real structure and volatility instead of a round percent, and never move one against yourself.
Most journals become a graveyard of screenshots nobody reads. Here is what to log, how to review it, and how to make the thing pay for itself in behaviour.
Overtrading is rarely a knowledge problem. It's a structure problem. Here are the behavioural and mechanical changes that make churn harder.
How breakouts actually work, why so many of them fail, and the two filters that separate a real move from noise.
Trend following is not about being smart or seeing the future. It is a boring, mechanical bet on asymmetry. Here is how it actually works and where it breaks.
Most traders obsess over entries. The ones who last obsess over how much they can lose. Here is how position sizing, stops, and survival actually work.
A trailing stop follows price up and never moves against you. Here is how the main types work, the trade-off between too tight and too loose, and how to think about setting one.
Trading signals can work. Most of the ones being sold to you do not, and the reasons are the same every time.